Chapter 04: Debug UI
Add ImGui.NET to the project for debug visualization
So far, any time we need to adjust a shader's parameter values, we need to edit C# code and recompile. It would be much faster to have a debug user interface (UI) in the game itself that exposes all of the shader parameters as editable text fields and slider widgets. We can also use the sliders to change a shader's input parameter and visualize the difference in realtime, which is a fantastic way to build intuition about our shader code.
In the previous tutorial series, you set up a UI using the GUM framework. GUM is a powerful tool that works wonderfully for player facing UI. However, for the debug UI we will develop in this chapter, we will bring in a second UI library called ImGui.NET. The two libraries will not interfere with one another, and each one works well for different use cases. ImGui.NET is great for rapid iteration speed and building developer facing UI. The existing GUM based UI has buttons and sliders that look and feel like they belong in the Dungeon Slime world. The ImGui.NET UI will look more like an admin console in your game. Despite the lack of visual customization, ImGui.NET is easy and quick to write, which makes it perfect for our developer facing debug UI.
If you are following along with code, here is the code from the end of the previous chapter.
Sample Source
The full source for this tuturial can be located on the 3.8.5 branch of the main MonoGame.Samples repository
As shown below:
https://github.com/MonoGame/MonoGame.Samples/tree/3.8.5/Tutorials/2dShaders
Adding a Debug UI Library
A common approach to building debug UIs in games is to use an Immediate Mode system. An immediate mode UI redraws the entire UI from scratch every frame. ImGui.NET is a popular choice for MonoGame. It is a port of a C++ library called DearImGui.
To add ImGui.NET, add the following Nuget package reference to the MonoGameLibrary project:
<Project Sdk="Microsoft.NET.Sdk">
    <!-- ... -->

    <ItemGroup>
        <PackageReference Include="ImGui.NET" Version="1.91.6.1" />
    </ItemGroup>

    <!-- ... -->
</Project>
In order to render the ImGui.NET UI in MonoGame, we need a few supporting classes that convert the ImGui.NET data into MonoGame's graphical representation.
Note
There is a sample project on ImGui.NET's public repository that we can copy for our use cases.
Create a new folder in the MonoGameLibrary project called ImGui and copy and paste the following files into the folder,
Important
These files are on a GitHub repository, so you CANNOT just "right-click - save as" to download them. Follow the links and then select the "download raw file" button in the upper-right of the file view.
There is unsafe code in the ImGui codebase, like this snippet, so you will need to enable unsafe code in the MonoGameLibrary.csproj file. Add this property:
<Project Sdk="Microsoft.NET.Sdk">
    <PropertyGroup>
        <TargetFramework>net9.0</TargetFramework>
        <AllowUnsafeBlocks>true</AllowUnsafeBlocks>
    </PropertyGroup>
    <!-- ... -->
</Project>
Note
Why unsafe?
The unsafe keyword in C# allows code to work directly with memory addresses (pointers). This is generally discouraged for safety reasons, but it is necessary for high-performance libraries. The ImGuiRenderer uses pointers to efficiently send vertex data to the GPU.
In order to play around with the new UI tool, we will set up a simple Hello World UI in the main GameScene. As we experiment with ImGui, we will build towards a re-usable debug UI for future shaders.
To get started, we need to have an instance of ImGuiRenderer. Similar to how there is a single static SpriteBatch, we will create a single static ImGuiRenderer to be re-used throughout the game.
In the
Core.csfile of theMonoGameLibraryproject, add the followingusingstatements at the top of theCore.csfile to get access to ImGui:using ImGuiNET; using ImGuiNET.SampleProgram.XNA;Note
If you see red squiggles on either using statement, remove them, build the project and try again to ensure there are no build issues with the project and the nuget package for ImGui has been cached for the project.
Then, add the following property to the
Coreclass:/// <summary> /// Gets the ImGui renderer used for debug UIs. /// </summary> public static ImGuiRenderer ImGuiRenderer { get; private set; }Then to initialize the instance, in the
Initialize()method, add the following snippet:protected override void Initialize() { base.Initialize(); // Set the core's graphics device to a reference of the base Game's // graphics device. GraphicsDevice = base.GraphicsDevice; // Create the sprite batch instance. SpriteBatch = new SpriteBatch(GraphicsDevice); // Create a new input manager Input = new InputManager(); // Create a new audio controller. Audio = new AudioController(); // Create the ImGui renderer. ImGuiRenderer = new ImGuiRenderer(this); ImGuiRenderer.RebuildFontAtlas(); }Similar to
SpriteBatch's.Begin()and.End()calls, theImGuiRendererhas a start and end function call. In theGameSceneclass, add these lines to end of the.Draw()method:protected override void Draw(GameTime gameTime) { // If there is an active scene, draw it. if (s_activeScene != null) { s_activeScene.Draw(gameTime); } // Draw debug UI Core.ImGuiRenderer.BeforeLayout(gameTime); // Finish drawing the debug UI here Core.ImGuiRenderer.AfterLayout(); base.Draw(gameTime); }ImGuidraws by adding draggable windows to the screen. To create a simple window that just prints out"Hello World", use the following snippet between theBeforeLayoutandAfterLayoutcalls:protected override void Draw(GameTime gameTime) { // ... // Draw debug UI Core.ImGuiRenderer.BeforeLayout(gameTime); ImGui.Begin("Demo Window"); ImGui.Text("Hello world!"); ImGui.End(); // Finish drawing the debug UI here Core.ImGuiRenderer.AfterLayout(); base.Draw(gameTime); }
When you run your DungeonSlime project, you should get a new "Debug" window as shown below:
 |
|---|
| Figure 4-1: a simple ImGui window |
Building a Material Debug UI
Each instance of Material is going to draw a custom debug window. The window will show the latest time the shader was reloaded into the game, which will help demonstrate when a new shader is being used. The window can also show the parameter values for the shader.
Add the following
usingstatements to the top of theMaterial.csfile in theGraphicsfolder:using ImGuiNET;And then add the following function to the
Materialclass:[Conditional("DEBUG")] public void DrawDebug() { ImGui.Begin(Effect.Name); var currentSize = ImGui.GetWindowSize(); ImGui.SetWindowSize(Effect.Name, new System.Numerics.Vector2(MathHelper.Max(100, currentSize.X), MathHelper.Max(100, currentSize.Y))); ImGui.AlignTextToFramePadding(); ImGui.Text("Last Updated"); ImGui.SameLine(); ImGui.LabelText("##last-updated", Asset.UpdatedAt.ToString() + $" ({(DateTimeOffset.Now - Asset.UpdatedAt).ToString(@"h\:mm\:ss")} ago)"); ImGui.NewLine(); bool ScalarSlider(string key, ref float value) { float min = 0; float max = 1; return ImGui.SliderFloat($"##_prop{key}", ref value, min, max); } foreach (var prop in ParameterMap) { switch (prop.Value.ParameterType, prop.Value.ParameterClass) { case (EffectParameterType.Single, EffectParameterClass.Scalar): ImGui.AlignTextToFramePadding(); ImGui.Text(prop.Key); ImGui.SameLine(); var value = prop.Value.GetValueSingle(); if (ScalarSlider(prop.Key, ref value)) { prop.Value.SetValue(value); } break; case (EffectParameterType.Single, EffectParameterClass.Vector): ImGui.AlignTextToFramePadding(); ImGui.Text(prop.Key); var vec2Value = prop.Value.GetValueVector2(); ImGui.Indent(); ImGui.Text("X"); ImGui.SameLine(); if (ScalarSlider(prop.Key + ".x", ref vec2Value.X)) { prop.Value.SetValue(vec2Value); } ImGui.Text("Y"); ImGui.SameLine(); if (ScalarSlider(prop.Key + ".y", ref vec2Value.Y)) { prop.Value.SetValue(vec2Value); } ImGui.Unindent(); break; case (EffectParameterType.Texture2D, EffectParameterClass.Object): ImGui.AlignTextToFramePadding(); ImGui.Text(prop.Key); ImGui.SameLine(); var texture = prop.Value.GetValueTexture2D(); if (texture != null) { var texturePtr = Core.ImGuiRenderer.BindTexture(texture); ImGui.Image(texturePtr, new System.Numerics.Vector2(texture.Width, texture.Height)); } else { ImGui.Text("(null)"); } break; default: ImGui.AlignTextToFramePadding(); ImGui.Text(prop.Key); ImGui.SameLine(); ImGui.Text($"(unsupported {prop.Value.ParameterType}, {prop.Value.ParameterClass})"); break; } } ImGui.End(); }Currently however, the control is not fully bound to the
Saturationparameter of thegrayscaleshader, inputs will always be overridden because theGameSceneitself keeps setting the value. In order to solve this, we introduce a custom property in theMaterialclass that causes the debug UI to override the variousSetParameter()methods.Next, add this new boolean to the
Materialclass:/// <summary> /// Override the default behaviour of the material properties so they can be controlled in Debug mode. /// </summary> public bool DebugOverride;Then, modify ALL of the
SetParameter()methods (float, matrix, vector2, etc) to exit early when theDebugOverridevariable is set totrue:public void SetParameter(string name, float value) { if (DebugOverride) return; if (TryGetParameter(name, out var parameter)) { parameter.SetValue(value); } else { Console.WriteLine($"Warning: cannot set shader parameter=[{name}] because it does not exist in the compiled shader=[{Asset.AssetName}]"); } }Then, in the
DrawDebug()method, after theLastUpdatedfield gets drawn, add this following:[Conditional("DEBUG")] public void DrawDebug() { ImGui.Begin(Effect.Name); var currentSize = ImGui.GetWindowSize(); ImGui.SetWindowSize(Effect.Name, new System.Numerics.Vector2(MathHelper.Max(100, currentSize.X), MathHelper.Max(100, currentSize.Y))); ImGui.AlignTextToFramePadding(); ImGui.Text("Last Updated"); ImGui.SameLine(); ImGui.LabelText("##last-updated", Asset.UpdatedAt.ToString() + $" ({(DateTimeOffset.Now - Asset.UpdatedAt).ToString(@"h\:mm\:ss")} ago)"); ImGui.AlignTextToFramePadding(); ImGui.Text("Override Values"); ImGui.SameLine(); ImGui.Checkbox("##override-values", ref DebugOverride); ImGui.NewLine(); // ...
Turning it off
As the number of shaders and Material instances grows throughout the rest of the tutorial series, it will become awkward to manage drawing all of the debug UIs manually like the _grayscaleEffect's UI is being drawn. Rather, it would be better to have a single function that would draw all of the debug UIs at once. Naturally, it would not make sense to draw every Material's debug UI, so the Material class needs a setting to decide if the debug UI should be drawn or not.
We will keep track of all the Material instances to draw as a static variable inside the Material class itself.
Note
Static classes are a useful feature to use when you need something to be accessible globally, meaning there can only ever be one. In the case of the Material class, we are adding a collection which will be the same collection no matter how many different Material definitions are running in the project. But remember, with great power comes great responsibility, Statics should be carefully considered before use as they can also be a trap if used incorrectly.
First, add the following at the top of the
Material.csclass:// materials that will be drawn during the standard debug UI pass. private static HashSet<Material> s_debugMaterials = new HashSet<Material>();Now, add a
booleanproperty to theMaterialclass, which adds or removes the given instances to thestaticset:/// <summary> /// Enable this variable to visualize the debugUI for the material /// </summary> public bool IsDebugVisible { get { return s_debugMaterials.Contains(this); } set { if (!value) { s_debugMaterials.Remove(this); } else { s_debugMaterials.Add(this); } } }To finish off the edits to the
Materialclass, add a method that actually renders all of theMaterialinstances in thestaticset, consuming theDrawDebugmethod we created earlier:[Conditional("DEBUG")] public static void DrawVisibleDebugUi(GameTime gameTime) { // first, cull any materials that are not visible, or disposed. var toRemove = new List<Material>(); foreach (var material in s_debugMaterials) { if (material.Effect.IsDisposed) { toRemove.Add(material); } } foreach (var material in toRemove) { s_debugMaterials.Remove(material); } Core.ImGuiRenderer.BeforeLayout(gameTime); foreach (var material in s_debugMaterials) { material.DrawDebug(); } Core.ImGuiRenderer.AfterLayout(); }Now in the
Coreclass'sDrawmethod, we need to call the new method in order to render the new Debug UI. And also delete the old ImGui test code used in theGameSceneto draw the_grayscaleEffect's debugUI. Replace the "entire"Drawmethod with the following version:protected override void Draw(GameTime gameTime) { // If there is an active scene, draw it. if (s_activeScene != null) { s_activeScene.Draw(gameTime); } Material.DrawVisibleDebugUi(gameTime); base.Draw(gameTime); }Note
The highlighted line is showing the new call for drawing the debug material renderers instead of the test ImGui code we had previously.
The
Coreclass does not yet know about theMaterialclass, so we will need to add an additional using to the top of the class:using MonoGameLibrary.Graphics;Tip
To keep things clean, you can also remove the old
using ImGuiNET;as you will see it is now greyed out because it is not used anymore since we removed the testImGuidrawing code.Finally, in order to render the debug UI for the
_grayscaleEffect, just enable theIsDebugVisibleproperty totruein theLoadContentmethod of theGameSceneclass:// Load the grayscale effect _grayscaleEffect = Content.WatchMaterial("effects/grayscaleEffect"); _grayscaleEffect.IsDebugVisible = true;
Now, when you run the game, you can see the debug window with the Saturation value as expected. If you enable the "Override Values" checkbox, you will also be able set the value by hand while the game is running (without setting it, the game has control, but still useful to see).
| Figure 4-2: Shader parameters shown while game is running |
Tip
If you do not want to see the debug UI for the grayscaleEffect anymore, just set IsDebugVisible to false, or delete the line entirely.
(Optional) DPI Scaling
If the Debug UI is too small on your screen, you can add the following snippet to Core's Initialize() method. Adjust the floating point values as necessary to fit your preferences.
protected override void Initialize()
{
    //...

    // Create the ImGui renderer.
    ImGuiRenderer = new ImGuiRenderer(this);
    ImGuiRenderer.RebuildFontAtlas();

    // Optional: Scale text and widgets for easier readability.
    var io = ImGui.GetIO();
    io.FontGlobalScale = 1.75f;
    ImGui.GetStyle().ScaleAllSizes(1.5f);
}
RenderDoc
The debug UI in the game is helpful, but sometimes you may need to take a closer look at the actual graphics resources MonoGame is managing. There are various tools that intercept the graphics API calls between an application and the graphics software. RenderDoc is a great example of a graphics debugger tool. Unfortunately, it only works with MonoGame when the game is targeting the WindowsDX profile. It may not be possible to switch your game to WindowsDX under all circumstances. At this time, there are very few options for graphic debuggers tools for MonoGame when targeting openGL.
Switch to WindowsDX
To switch DungeonSlime to target WindowsDX, you need to modify the .csproj file, and make some changes to the .mgcb content file.
First, in the
.csprojfile, remove the reference to MonoGame's openGL backend:<PackageReference Include="MonoGame.Framework.DesktopGL" Version="3.8.*" />And replace it with this line:
<PackageReference Include="MonoGame.Framework.WindowsDX" Version="3.8.*" />The
MonoGame.Framework.WindowsDXNuget package is not available for thenet9.0framework. Instead, it is only available specifically on the Windows variant, callednet9.0-windows. Change the<TargetFramework>in your.csprojto the new framework:<TargetFramework>net9.0-windows</TargetFramework>Next, in the
Content.mgcbfile, update the target platform fromDesktopGLtoWindows,/platform:WindowsRenderDoc only works when MonoGame is targeting the
HiDefgraphics profile. This needs to be changed in two locations. First, in the.mgcbfile, change the/profilefromReachtoHiDef./profile:HiDefFinally, in the
Coreconstructor, set the graphics profile immediately after constructing theGraphicsinstance:// Create a new graphics device manager. Graphics = new GraphicsDeviceManager(this); Graphics.GraphicsProfile = GraphicsProfile.HiDef;
Important
The rest of this tutorial series assumes you are using the DesktopGL configuration. After you are done experimenting with RenderDoc using WindowsDX, please switch the project back to DesktopGL.
If you want to see how a project can be built for both DesktopGL and WindowsDX at the same time, check out the mgblank2dstartkit (MonoGame Blank 2D Starter Kit) MonoGame template.
The WindowsDX format should work for most of this tutorial, except for chapter 9 (shadows) which needs a bit of extra complexity to work due to the complexities in building cross-platform shaders.
Using RenderDoc
Make sure you have built DungeonSlime. You can build it manually by running the following command from the DungeonSlime directory:
dotnet build
Once you have downloaded RenderDoc, open it and Go to the Launch Application tab, then select your built executable in the Executable Path.
For example, the path may look similar to the following:
C:\proj\MonoGame.Samples\Tutorials\2dShaders\src\04-Debug-UI\DungeonSlime\bin\Debug\net9.0-windows\DungeonSlime.exe
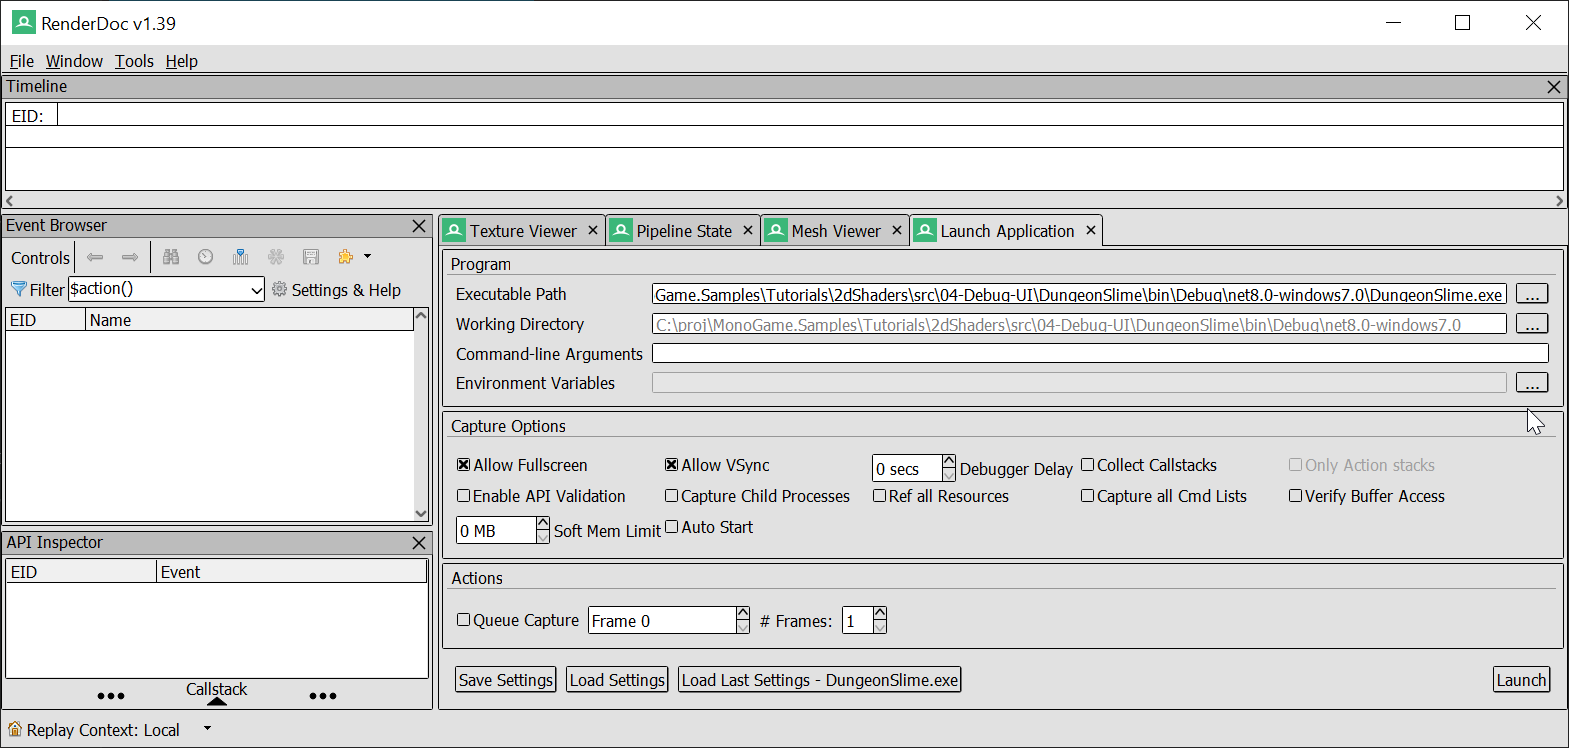 |
|---|
| Figure 4-3: The setup for RenderDoc |
Then, click the Launch button in the lower right. DungeonSlime should launch with a small warning text in the upper left of the game window that states the graphics API is being captured by RenderDoc.
| Figure 4-4: Renderdoc analysing and capturing frames |
Press F12 to capture a frame (as shown above), and it will appear in RenderDoc. In RenderDoc, Double click the frame to open the captured frame, and go to the Texture Viewer tab. The draw calls are split out one by one and you can view the intermediate buffers.
Note
You MUST have the game in focus to capture frames, as the target window has to be selected in order to capture frames. If you have the RenderDoc window in focus, nothing will happen.
 |
|---|
| Figure 4-5: RenderDoc shows the intermediate frame |
From here, you can better understand how rendering is working in your game, especially if you are having performance or graphical issues. It is a bit beyond the scope of this tutorial to go into the deep details, for now you can just examine it to get used to the tool.
Tip
RenderDoc is a powerful tool. To learn more about how to use the tool, please refer to the RenderDoc Documentation.
Conclusion
What a difference a good tool makes! In this chapter, you accomplished the following:
- Integrated the
ImGui.NETlibrary into a MonoGame project. - Created a reusable
ImGuiRendererto draw the UI. - Built a dynamic debug window for our
Materialclass. - Learned how to use a graphics debugger like RenderDoc to inspect frames.
With our workflow and tooling in place, it is finally time to write some new shaders. Up next, we will dive into our first major pixel shader effect and build a classic screen wipe transition!
You can find the complete code sample for this chapter - here.
Continue to the next chapter, Chapter 05: Transition Effect.